Smart Manufacturing Systems with the Internet of Things
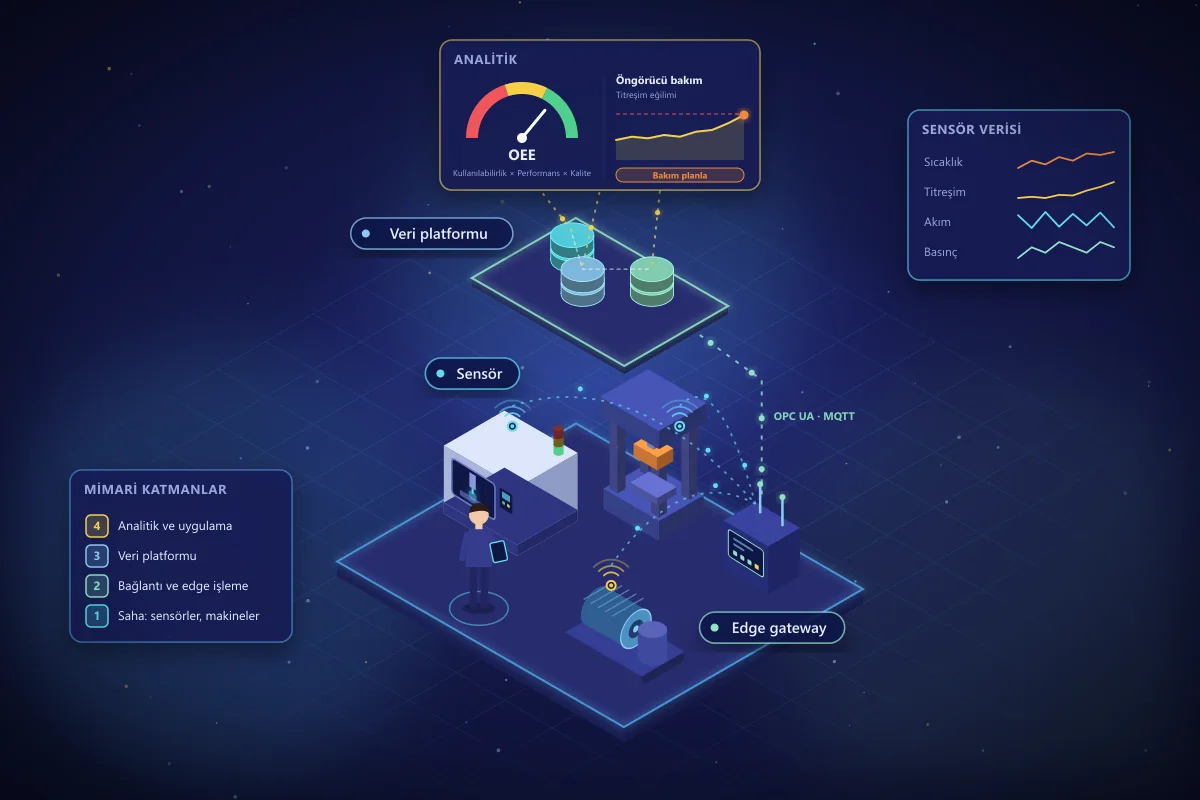
Thousands of events happen on a production line every day: machines run, stop, speed up, heat up, and vibrate. Most of these events are never recorded anywhere, or they end up on a form filled in by hand at the end of a shift. The Industrial Internet of Things (IIoT) captures this invisible data through sensors and connected devices and makes production visible in real time.
In this article, we explain the layers that make up a smart manufacturing system, where to start with IoT, and the most common mistakes.
The Layers of a Smart Manufacturing System
1. The shop floor: sensors and machines
Values such as temperature, vibration, current, pressure, humidity, and cycle time are measured by sensors. Most new machines already generate this data through their own controllers (PLCs); older machines are connected with external sensors. This makes it possible to collect data without replacing the entire machine fleet.
2. Connectivity and edge processing
Shop-floor data is collected via industrial protocols such as OPC UA or MQTT. Edge devices pre-process the data on site: they filter out redundant readings, generate instant alarms locally, and send only meaningful data to the central system. This approach both reduces network load and prevents data loss when the connection drops.
3. Data platform
Machine data is combined with production orders, quality records, and maintenance history in a single data model. Knowing that a machine stopped is valuable; knowing which product it was making, during which shift, and how many days after which maintenance it stopped is far more valuable.
4. Analytics and applications
The collected data is turned into OEE (Overall Equipment Effectiveness) dashboards, downtime analyses, predictive maintenance models, and management dashboards. This is the layer where value emerges.
Where Does IoT Deliver Value First?
- Real-time OEE tracking: Availability, performance, and quality losses are visible instantly, not at the end of the shift.
- Downtime root-cause analysis: The duration and cause of each stoppage are recorded automatically, revealing the three to five causes behind the most losses.
- Energy monitoring: Energy consumption is measured per machine, making idle running and unplanned consumption visible.
- Predictive maintenance: Vibration and temperature trends are monitored so maintenance can be scheduled before failure risk develops.
- Quality traceability: The process parameters used to produce each item are recorded.
Where Should You Start?
- Pick one line and one question. Instead of "let's digitize the factory," start with a question such as "why does our bottleneck machine stop three times a week?"
- Use the data you already have. Connecting to data already available in machine controllers comes before investing in new sensors.
- Involve operators in the process. Accurate entry of downtime reasons and the use of dashboards on the shop floor determine how reliable the data is.
- Measure the results, then scale. Once the improvement on the pilot line has been measured, the model is rolled out to other lines.
Common Mistakes
- Trying to measure everything: Data without a defined purpose generates storage costs but no decisions.
- Leaving security until the end: Separating the production network from the office network and controlling device access must be designed in from the start.
- Isolating data from your systems: Machine data that is not connected to MES and ERP remains a set of numbers without context.
Conclusion
The Internet of Things is the nervous system of smart manufacturing, but it is a tool for better decisions, not a goal in itself. A small pilot that starts with the right question delivers measurable results quickly and lays the groundwork for more advanced automation goals such as the dark factory. To turn your production data into decisions, explore our data analytics and decision support service.
Related service
Data Analytics and Decision Support Frameworks
Latest Insights
 blueskydx
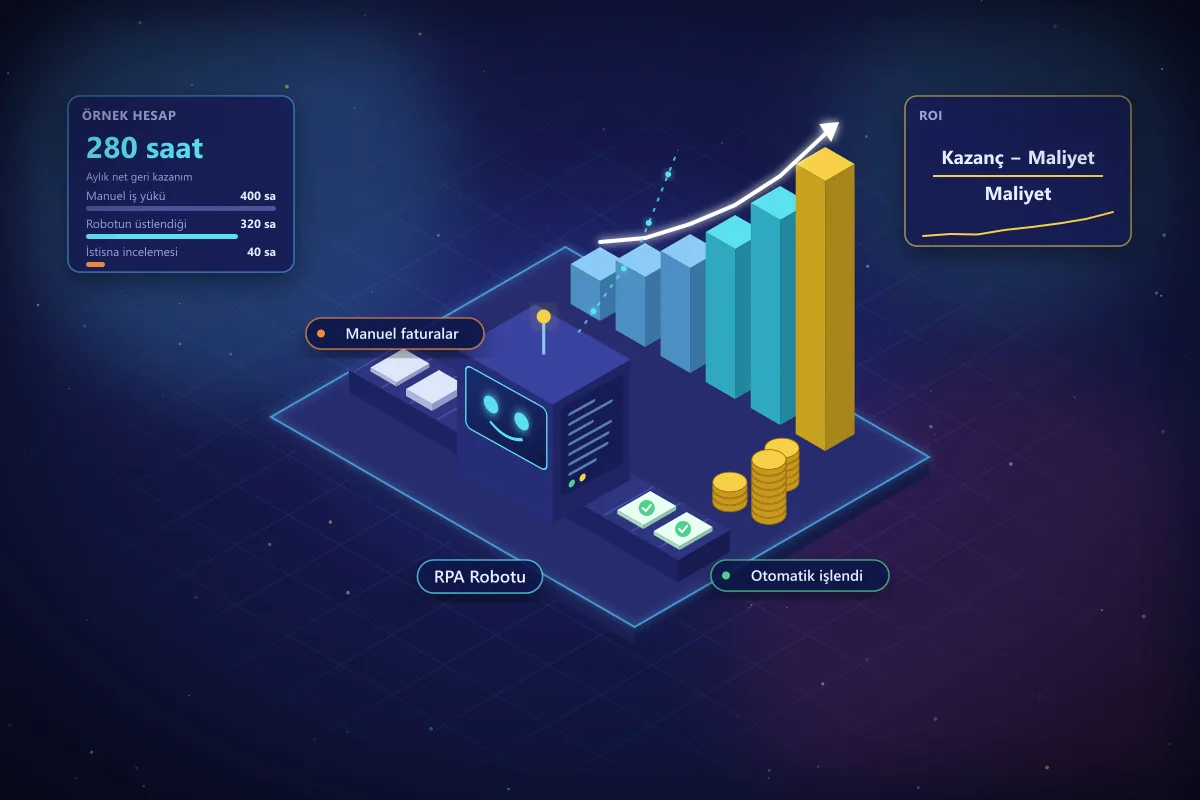
How to Calculate the ROI of an RPA Investment
Before starting an RPA project, how do you know which processes will actually pay off? A step-by-step ROI guide covering cost items, benefit items, a sample calculation, and common mistakes.
 blueskydx
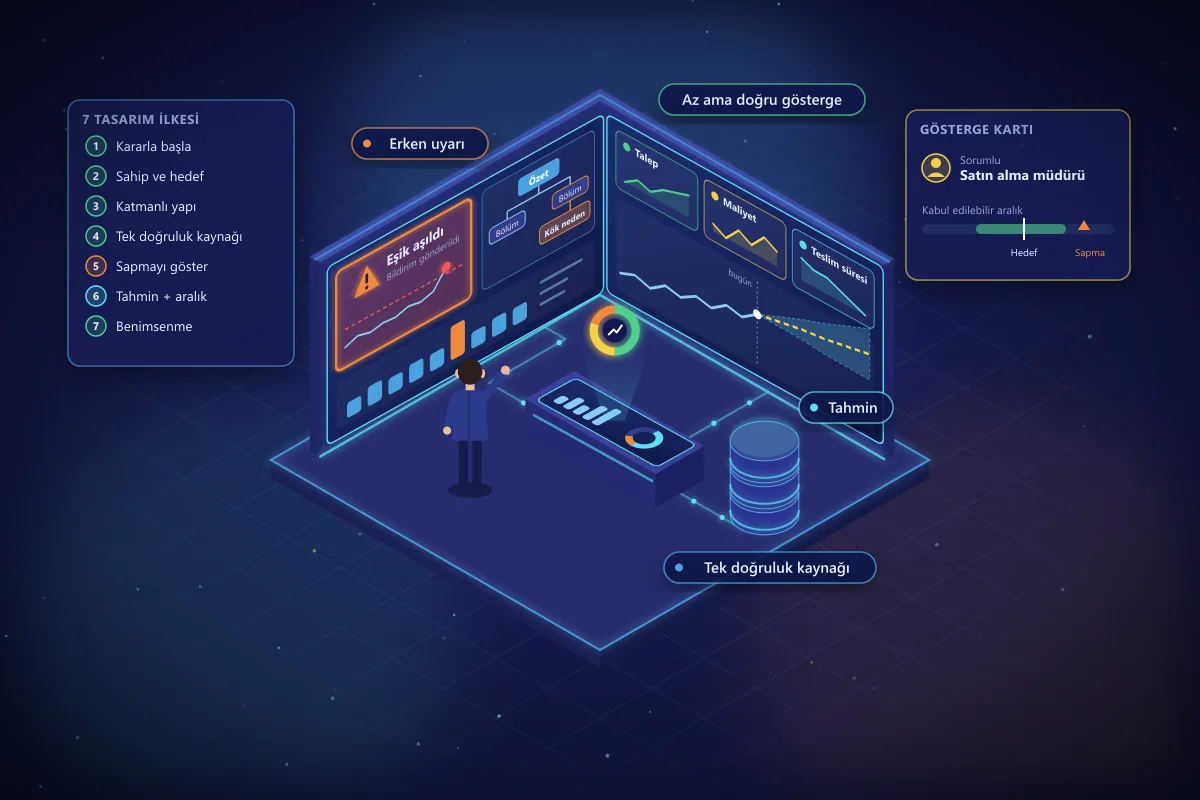
AI-Powered Management Dashboard Design: 7 Principles
Most management dashboards show a lot but drive few decisions. Seven design principles for an effective dashboard, from choosing the right indicators to early warnings, forecasting models, and user adoption.
 blueskydx
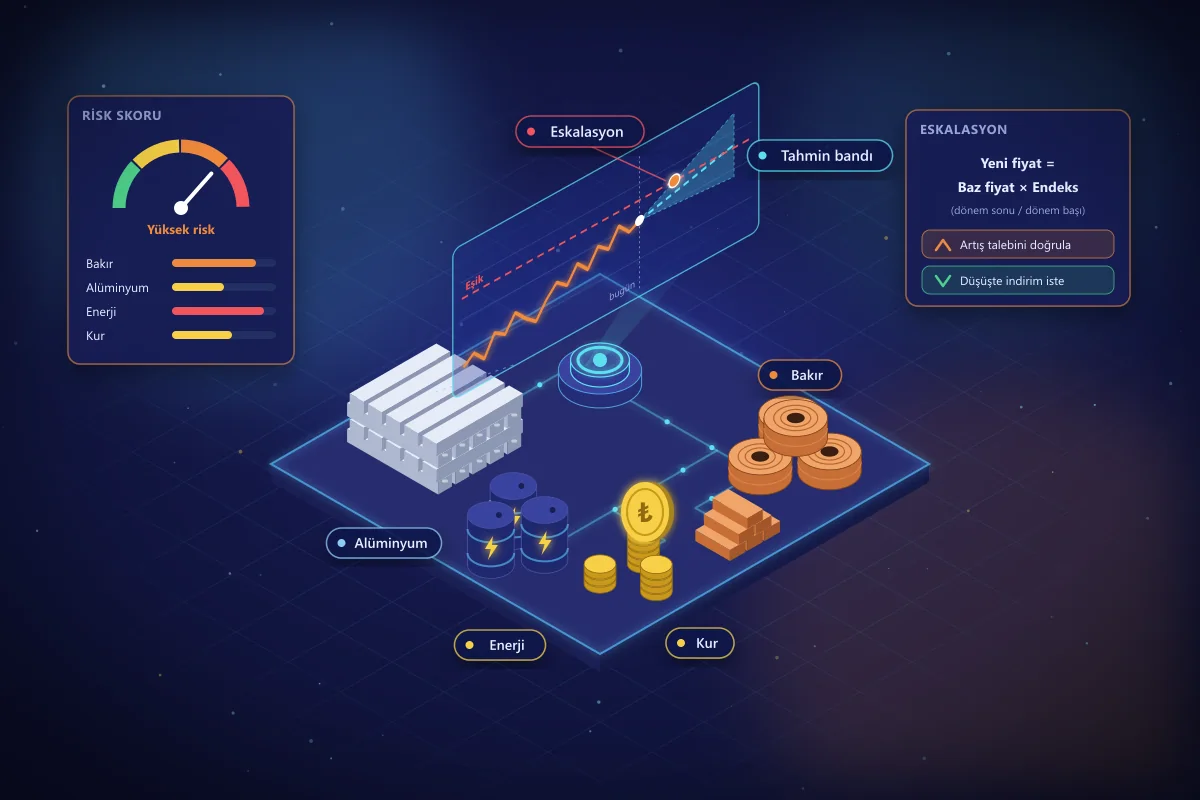
Commodity Price Risk: AI Forecasting and Escalation
Swings in copper, aluminum, energy, and exchange rates directly affect procurement costs. How to manage commodity risk with AI-powered price forecasting and escalation tracking.
