AI-Powered Management Dashboard Design: 7 Principles
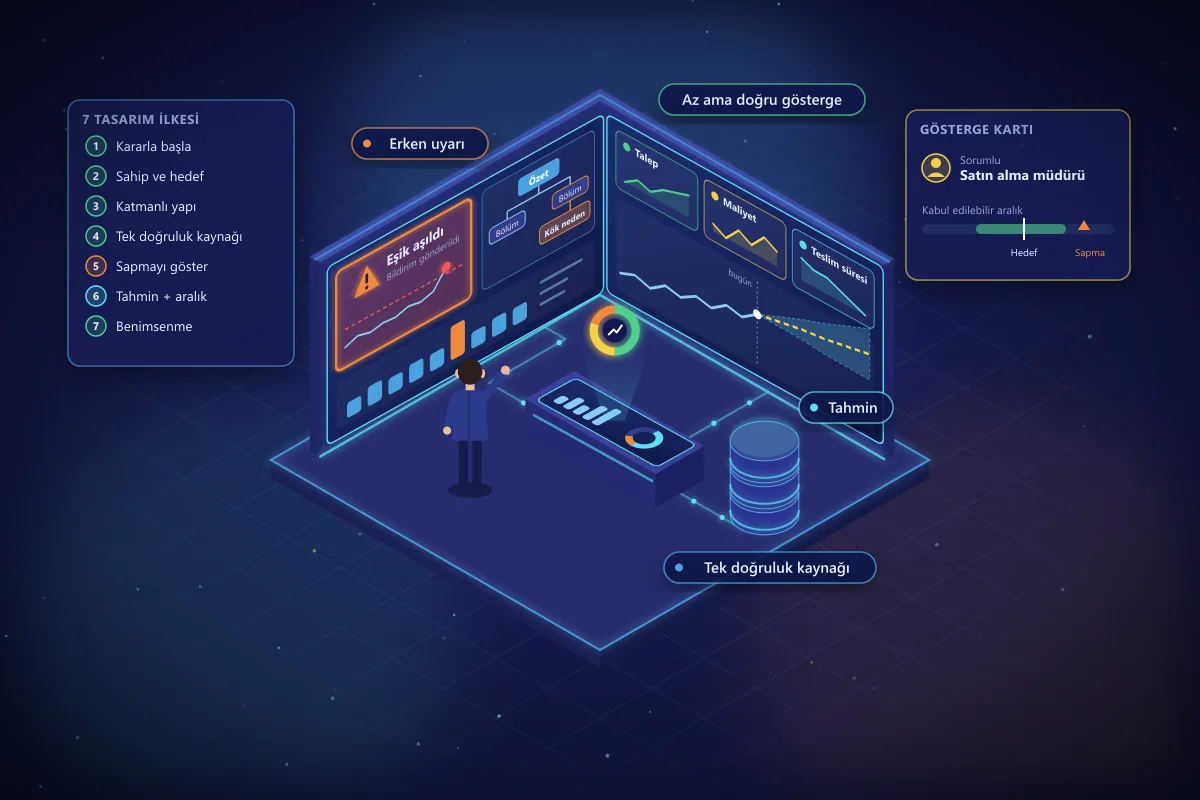
In many organizations, management dashboard projects end the same way: dozens of charts, colorful gauges, and, a few months later, a screen nobody opens. The problem is usually not the technology but the design. The dashboard is built around where the data lives, not around the decisions the manager needs to make.
An AI-powered management dashboard aims to go beyond reporting the past, catching deviations early and anticipating what comes next. In this article, we share the seven principles we follow when designing such a dashboard.
1. Start With the Decision, Not the Chart
The first design question should not be "What data should we show?" but "What decision will the person looking at this screen make?" For a procurement manager, the decision is which supplier to work with and at what price; for a production manager, it is which line will stop and why. The three to five indicators needed for each decision are worth more than hundreds of metrics.
2. Give Every Indicator an Owner and a Target
An indicator without an owner moves no one to act when it turns red. Every KPI should have a responsible person, a target value, and an acceptable range. That way, the dashboard shows not only the status but also who needs to do what.
3. Build a Layered Structure
Senior management, department heads, and operations teams look at the same data at different depths. A good dashboard has a layered structure that lets users drill down from the summary view to the root cause in two or three clicks. Every number in the top layer should be explained in the layer below.
4. Establish a Single Source of Truth
If revenue in the finance report differs from revenue in the sales report, the dashboard loses trust. Data from ERP, CRM, MES, and spreadsheets should be combined in a shared data model, and the definition and calculation method of every indicator should be documented. Without a common data language across departments, the AI layer cannot produce accurate results either.
5. Show Deviations, Not History
A manager's time is limited. The dashboard should quietly pass over areas where everything is on track and highlight the points that need attention. Anomaly detection models reduce unnecessary alerts by distinguishing normal fluctuation from real deviation. Automatic notifications sent to the right person when a threshold is crossed allow action to be taken without waiting for someone to open the dashboard.
6. Make Forecasts Visible and Explainable
Demand, cost, or lead time forecasts should be shown on the dashboard as a continuation of historical data, together with an uncertainty range. Presenting a range instead of a single number helps managers read risk correctly. Showing the main factors driving a forecast also builds trust in the model: instead of saying "demand will rise this month," being able to say "because of the campaign calendar and last year's seasonality."
7. Make Adoption Part of the Design
Even the best dashboard creates no value if it is not used. Running weekly meetings from the dashboard's screens, training users, and updating it regularly based on feedback are the most effective paths to adoption. Keeping the first version small and evolving it together with users delivers better results than a large, flawless first release.
An Example From the Field
We applied most of these principles in our decision support dashboard, which tracks commodity prices and generates trend forecasts and risk scores: instead of the entire market, we showed managers their own favorite commodities, escalation cases, and recommended actions. As a result, time spent on market monitoring fell by 80%.
Conclusion
An AI-powered management dashboard means better decisions, not more charts. A dashboard that starts with decisions, focuses on deviations, and evolves with its users strengthens an organization's management reflexes. If you would like to design a dashboard tailored to your organization, explore our AI-powered management dashboard service.
Related service
AI-Powered Management Dashboard Design and Implementation
Latest Insights
 blueskydx
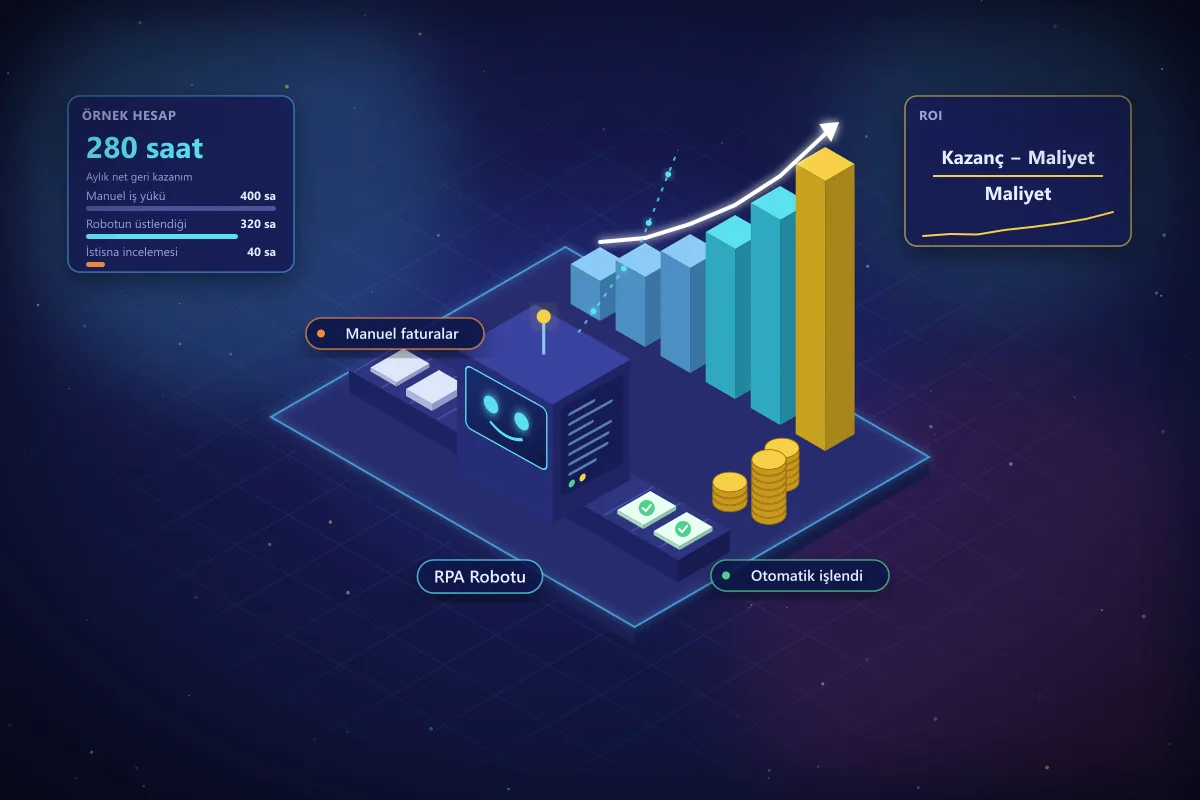
How to Calculate the ROI of an RPA Investment
Before starting an RPA project, how do you know which processes will actually pay off? A step-by-step ROI guide covering cost items, benefit items, a sample calculation, and common mistakes.
 blueskydx
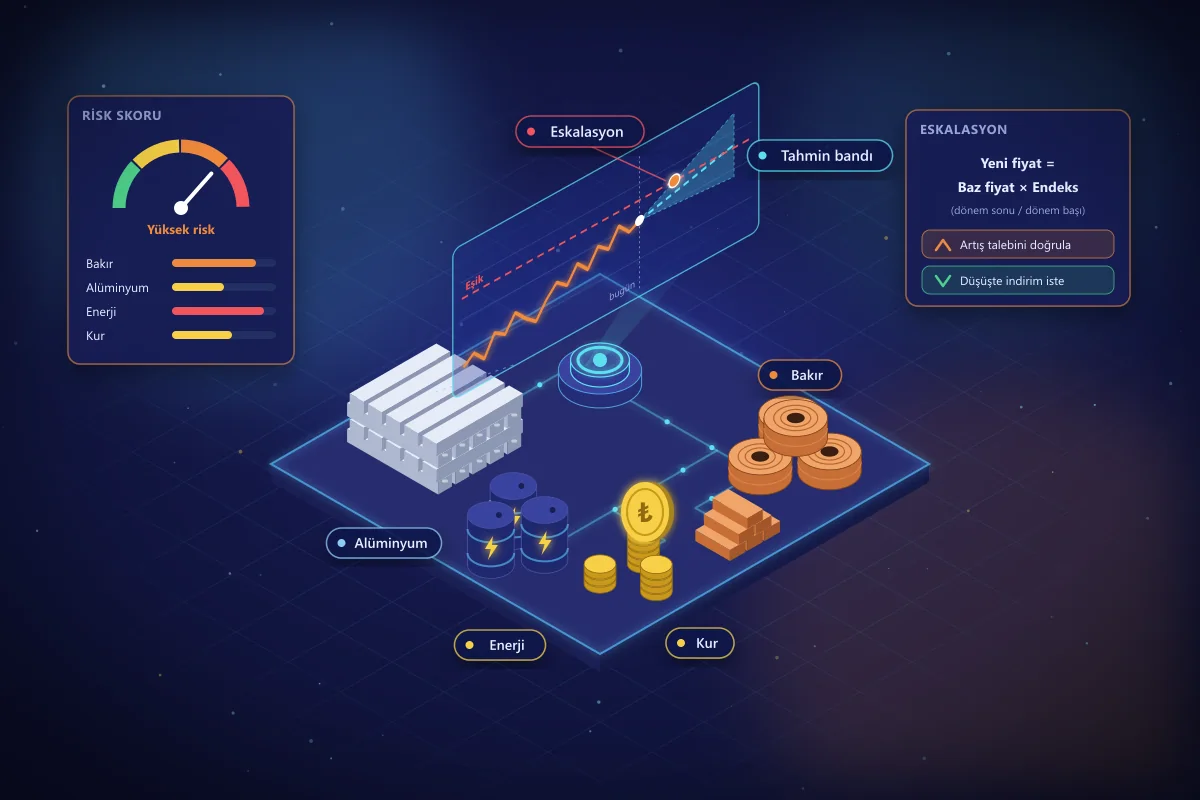
Commodity Price Risk: AI Forecasting and Escalation
Swings in copper, aluminum, energy, and exchange rates directly affect procurement costs. How to manage commodity risk with AI-powered price forecasting and escalation tracking.
 blueskydx
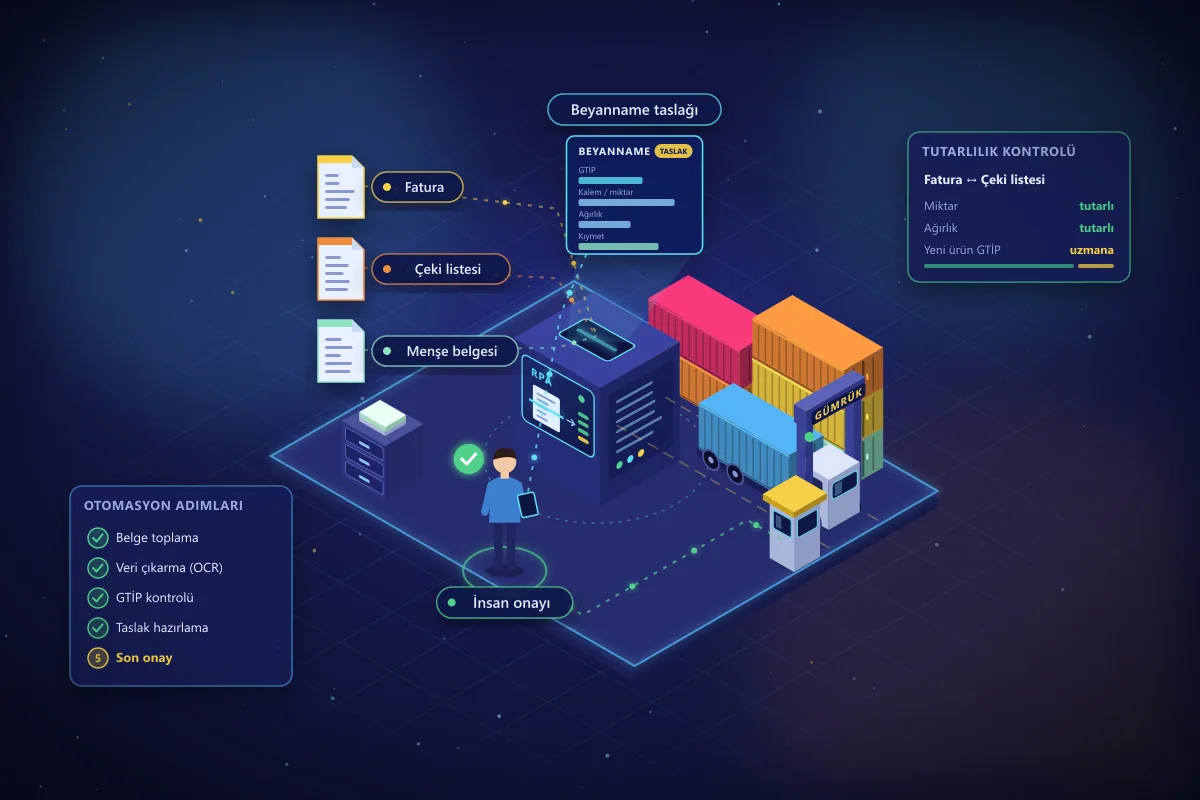
Customs Declaration Automation: Speeding Up With RPA
From invoices, packing lists, and certificates of origin to the draft declaration: which customs steps can be automated with RPA, and which should remain subject to human approval? A step-by-step guide.
