AI-Powered Management Dashboard Design and Implementation
Tailored to each organization, this service covers the design of critical management indicators, cross-departmental data flows, early warning mechanisms, predictive analytics structures and decision support screens.
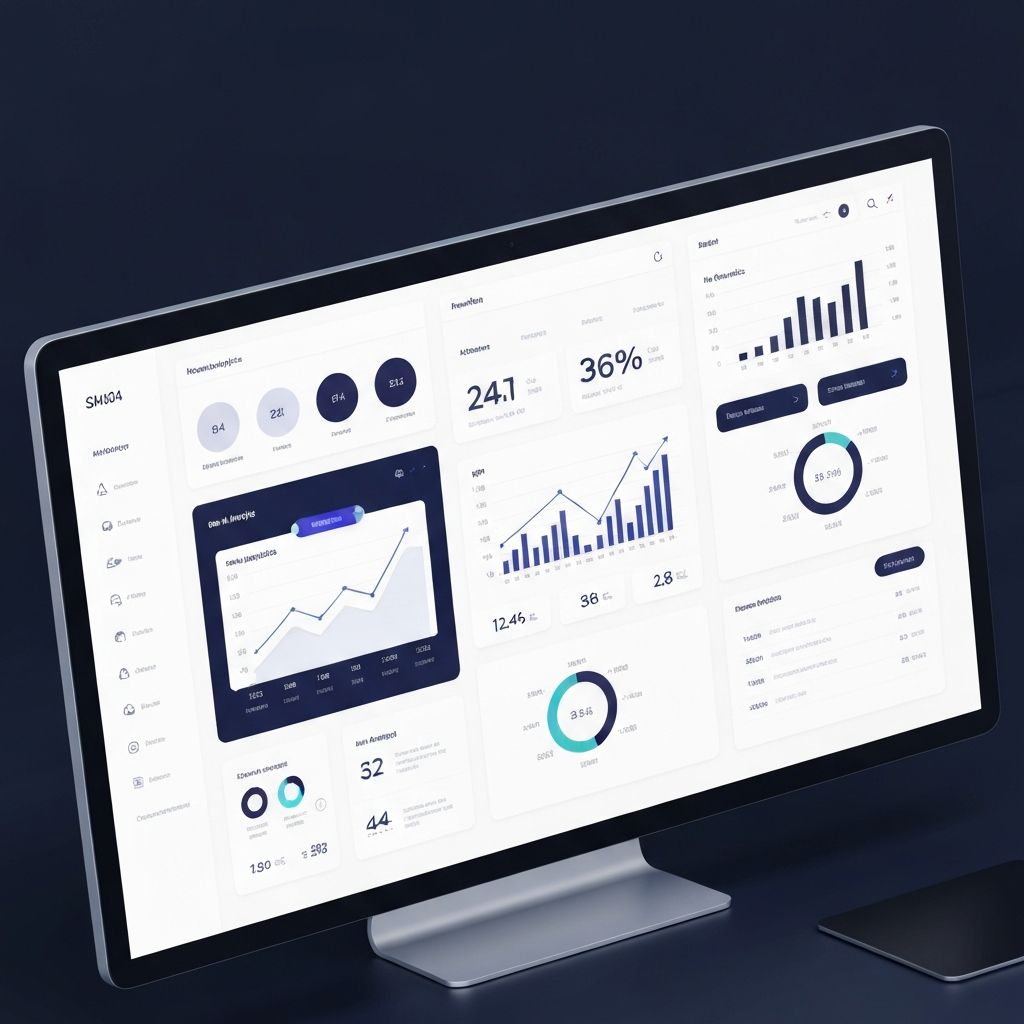
Tailored to each organization, this service covers the design of critical management indicators, cross-departmental data flows, early warning mechanisms, predictive analytics structures and decision support screens. The goal is to create a faster, more transparent and more accurate management experience across every decision-making layer, from executive leadership to operations teams.
Why an AI-Powered Dashboard?
Traditional reporting tools present backward-looking data. AI-powered dashboards, by contrast, analyze historical data to generate forward-looking forecasts, detect deviations early and enable executives to make proactive decisions.
How We Work
We begin by analyzing the organization's existing data sources and management needs. We then design customized indicator sets for each department, implement data integrations and deploy AI models. In the final phase, we deliver user training and launch a continuous improvement cycle.
The Value It Delivers
Instead of waiting for weekly reports, executives can now take the pulse of the organization in real time. Data inconsistencies between departments disappear, decision-making cycles shorten, and the link between strategic goals and operational reality grows stronger.
Service Scope
- Design of critical management indicators (KPIs)
- Cross-departmental data flow integration
- Early warning and anomaly detection mechanisms
- Predictive analytics and scenario modeling
- Decision support screens and reporting
Related Projects
Dark Factory Project
Design and implementation of a fully autonomous production line that minimizes human intervention.
AI-Powered Commodity Price Forecasting and Risk Analysis
Development of a platform for AI-powered analysis of commodity market price movements, trend forecasting and risk management.
Frequently Asked Questions
What is an AI-powered management dashboard?
It is a management screen that brings together data from the organization's various systems in a single view; beyond reporting on the past, it detects deviations early, generates forecasts and offers decision recommendations. Unlike a traditional dashboard, it shows not only what happened but also what will happen and what needs attention.
How does it differ from traditional BI reporting?
BI tools mostly produce backward-looking reports. Adding an AI layer brings anomaly detection, demand and cost forecasting, scenario analysis and automated alerts into play, so executives can take action without waiting for the weekly report.
Which data sources does it work with?
ERP, MES, CRM, accounting and production systems, Excel-based spreadsheets and IoT sensor data can all be connected to the dashboard. The integration scope is determined during the initial analysis phase based on the organization's existing infrastructure.
How does the project process work?
It proceeds through needs and data source analysis, indicator set design, data integration, AI model deployment and user training. Scope and timeline are finalized based on the number of systems to be connected.
Learn More About This Service
Get in touch with our team for a solution tailored to your needs.
Other Services
Digital Transformation Consulting
Digital transformation is not just about choosing software; it is about defining the right priorities and structuring investments on the right architecture. BlueSkyDX analyzes each organization's current maturity level.
Process Mining and Process Visibility
Lasting improvement is impossible without understanding how business processes actually run. Our process mining approach makes process flows visible using operational data.
RPA and Intelligent Automation Solutions
Handling repetitive, rule-based work manually wastes time and creates risk of error. Our intelligent automation and RPA solutions deliver speed and standardization.
Data Analytics and Decision Support Frameworks
The data organizations hold often stays at the reporting level. BlueSkyDX transforms this data into an analytics framework that informs management decisions.
Training and Transformation Capability Development
The success of technology is directly tied to how well it is understood and used within the organization. We provide training for executives and their teams.
